Pictures Worth A Thousand Words
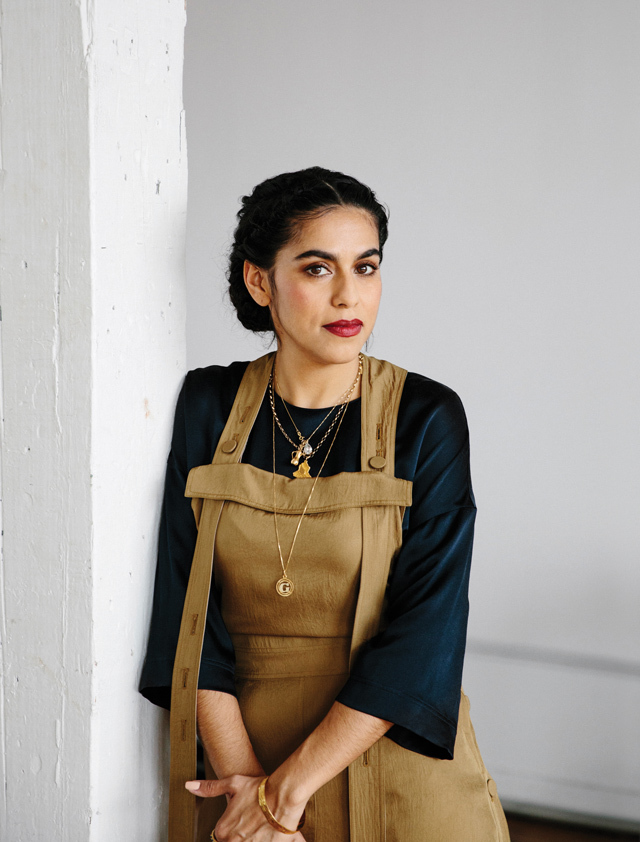
“THERE WERE NO other Arabs where I grew up, which contributed to me always feeling like an outsider,” recalls Iraqi-British artist and data journalist Mona Chalabi of her childhood in East London.
This outsider perspective has always informed the 32-year-old’s career trajectory, a course that is refreshingly self-defined and self-aware. After earning her master’s in International Security from the Paris Institute of Political Studies, Chalabi worked for the Bank of England and the United Nations. Then, in 2014, Chalabi moved to New York to write for Nate Silver’s website, FiveThirtyEight. There, she penned the “Dear Mona” column, in which she explored questions such as “Where do I fit in the world?” and “Am I normal?” Rather than simply dispense advice, Chalabi offered data to help contextualize readers’ experiences. Yet for all of her efforts to help folks, she felt deeply alienated as the only woman of color and only immigrant working on the site.
When her data journalism illustrations started going viral on Instagram in 2017—including one depicting the gender and race pay gaps with folded dollar bills and another that turns the American Flag into a bar graph with each stripe, representing the U.S. population, getting shorter as immigrants, people of color, or women are removed—Chalabi discovered a new career in visual art. Now, working for the Guardian US, Chalabi is centering stories, subjects, and groups historically marginalized by the mainstream media. Meanwhile, her art has transitioned from Instagram feeds to galleries, with her first major exhibition “Who Are You Here To See?” taking over London’s Zari Gallery this past May. Yet, despite her popularity and her success, she remains skeptical about her impact, applying the same critical thinking to herself as she does to the data she analyzes. Here, Chalabi speaks candidly about using images to shape how we see the world.
“Journalism is supposed to be a publicly accessible good for the many, not the few.”
How did you get the idea to illustrate data journalism?
I took a job for FiveThirtyEight and realized very early on that I hated it. It was elitist and, to a certain extent, divorced from reality. In that field you get respect for being super intelligent even if the way that you are depicting things alienates other people. I became disillusioned. I knew that I wasn’t going to fit in. I wasn’t going to earn their respect because the way I approach journalism and data is too inclusive. I was so depressed and anxious in that job that I would sit in my little booth, get out a piece of paper, and try to come up with story ideas. I started drawing, and it saved me. I had just joined Instagram and had about 20 followers. I posted a drawing and one of my colleagues, another woman writer who worked remotely, posted underneath it, “This is great.” I was so desperate to be seen in any way shape or form, that that was all it took. I got a few more followers and then this weird thing happened: Jerry Saltz [art critic for New York magazine] posted one. It was being seen by this other world. That got me going.

Can you speak about the importance of taking an inclusive approach to journalism?
Journalism is supposed to be a publicly accessible good for the many, not the few. I don’t have this blind faith in data to cure all evils. I take a very skeptical and cynical approach to the data by acknowledging my biases. Even the decision to make things hand drawn is an effort to remind people that a human with their own subjectivities created this image.


How do you choose the subjects you report?
I look at academic sites like Eureka, which publish the newest academic pieces. I see some of my role as acting as a translator for academics, who often publish in a way that is so alienating that their findings are often not communicated to a broader public. Also, I watch the news. But I would say my most important source is people sending me direct messages [on Instagram]. Someone DM’d me the other day and asked, “Why haven’t you done anything on Sudan?” I try to be as transparent as possible about the fact that every single subject that I approach is informed by my own experience. It’s impossible for me to step outside of my skin, so I need your DMs to tell me, “Hey, you’ve forgotten about this thing. Why don’t you write about it?”
How does the subject matter inform your approach towards depicting data visually?
I want you to glance at the chart and, even without reading it, have some sense of the subject in order to make it memorable. It can be hard to do that sensitively sometimes. There are so many subjects, like sexual assault, that are incredibly difficult. One of the first things I will do is a Google image search for “sexual assault” to see what visual language already exists. I understand why often all you see is the image of a woman holding her head in her hands. I get why newspapers want to use that: it’s safe, but it’s also bullshit. The reality is that someone who suffered a sexual assault will very often get up and go to work the next day and you will not have a clue. That’s part of the power of it. But where does that leave me in terms of my visual depiction? I grapple with this a lot. The search for the right visual language is difficult because you are reinforcing visual notions that already exist in your search to find something that is going to be instantly comprehensible. How can you tread that line without being confusing?
How has your exposure to the art world shaped your ideas about making art?
My first major exhibition was an eye opener as to why the people who end up in galleries come from wealth. I spent $5,000 putting it together. I don’t think I am going to recoup that money and, if I am really honest, I regret doing it. It sucks but I came to the realization that I don’t want my art to only be in the hands of wealthy people. Now I’m trying to think about larger scale projects I can do, and for that work to be accessible to all people.
Are you aware of the impact your work has on the public?
I remain deeply skeptical that I have had any impact whatsoever. It’s great that I’ve gone from 23 Instagram followers to 140,000, but I don’t know if that’s impact. There are so few occasions where there is a comment underneath one of my posts saying, “You changed my mind.” But after the 2016 election, I stopped caring about trying to change people’s minds. Just now, I went to check my Instagram for comments, and someone posted about what to do if ICE raids your workplace. That is the kind of essential journalism we should be doing right now. It’s about survival.


By Miss Rosen
Photos by Laurel Golio
This article originally appeared in the September/October 2019 print edition of BUST Magazine. Subscribe today!
More from BUST
Ignoring Female Expertise Proves We Know Nothing At All, Really
This Anthology By Women Of Color Tells The Stories We’ve Been Missing
19th Century Journalist Nellie Bly Broke Barriers And Became A Legend In Her Field


